Georgios Karamanis
|||
Georgios Karamanis
About
IKEA place names
Tablettraknare
Photography
Data
Made
Search
Archives
Feed
↑

I am a data visualization designer, psychiatrist and researcher, based in Uppsala, Sweden.
I love data management and making elegant and creative data visualizations. I have a strong background in visual arts and design and previously worked as a freelance photographer.
Besides client work, I have completed hundreds of personal projects, including 200+ weekly TidyTuesday submissions, #30DayMapChallenge, and #30DayChartChallenge. I also make generative art with R.
You can find my code on GitHub and follow me on social media.
Scientific American: US drought visualization (with Cédric Scherer), also featured in the R for the Rest of Us book
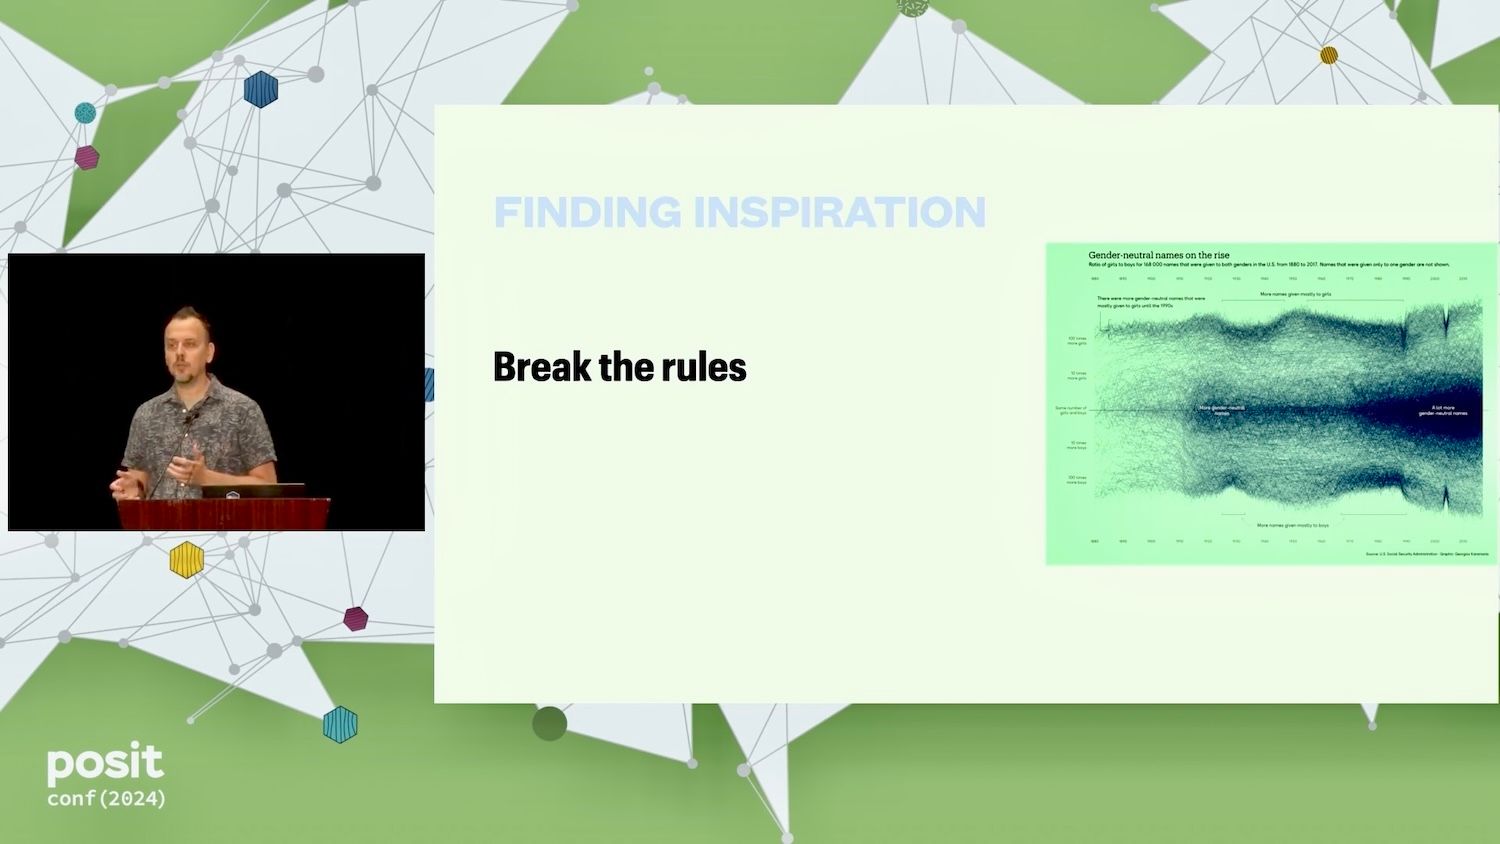
Visual Capitalist: Olympic athletes, gender-neutral names