

The RWeka package in R provides a convenient interface to the powerful machine-learning algorithms offered by the Weka library. Weka is a widely used suite of machine learning software that contains a collection of tools for data preprocessing, classification, regression, clustering, and visualization.
Setting Up RWeka
To use RWeka, you first need to install the package and load it into your R session.
install.packages("RWeka")Applying RWeka Functions
RWeka supports a wide range of machine-learning algorithms. You can use functions like Weka_control() to create parameters for your model, and functions like J48() for decision trees and NaiveBayes() for Naive Bayes classifiers.
- Classification:
J48(),NaiveBayes() - Regression:
REPTree(),M5() - Clustering:
KMeans()
Now we will discuss tep by step How to Use RWeka Package on a Dataset using R Programming Language:
Step 1: Load a Dataset
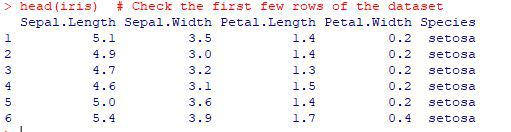
You can either load a built-in R dataset or import your own dataset (CSV, Excel, etc.). For demonstration purposes, we'll use the iris dataset, which is commonly used for classification tasks.
data(iris)
head(iris)  # Check the first few rows of the dataset
Output:
Step 2: Apply a Machine Learning Algorithm
RWeka provides various algorithms. Let's use J48 (Weka's version of the C4.5 algorithm for decision trees) .
The J48() function will train a decision tree model on the dataset.
# Train a decision tree model
model <- J48(Species ~ ., data = iris)

# Print the model structure
print(model)
Output:
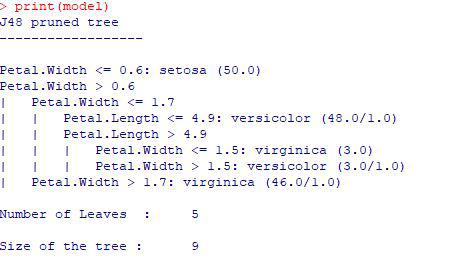
This builds a decision tree to classify the Species (target variable) based on the other features in the iris dataset (Sepal.Length, Sepal.Width, etc.).
Step 3: Make Predictions
Use the predict() function to make predictions on new data. You can either use the same dataset (for simplicity) or use a separate test dataset.
# Predict on the same dataset (iris)
predictions <- predict(model, iris)

# View the first few predictions
head(predictions)
Output:

Step 4: Evaluate the Model
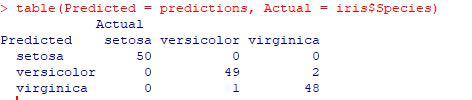
To evaluate the model, compare the predictions to the actual labels using a confusion matrix.
# Create a confusion matrix to evaluate performance
table(Predicted = predictions, Actual = iris$Species)
Output:
Step 5: Cross-Validation
To perform cross-validation (e.g., 10-fold cross-validation) and get more robust performance metrics, use the evaluate_Weka_classifier() function.
# Perform 10-fold cross-validation
evaluation <- evaluate_Weka_classifier(model, numFolds = 10)
print(evaluation)
Output:
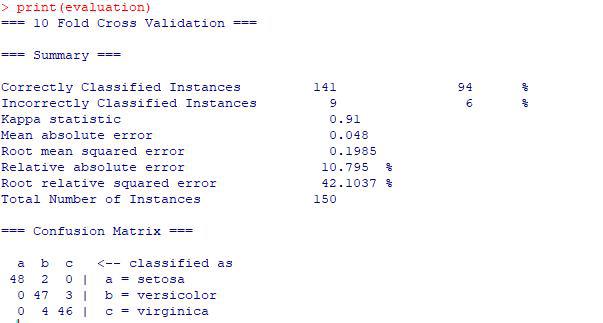
This function outputs detailed statistics about model performance (e.g., accuracy, precision, recall) based on the cross-validation process.
Example for Regression using REPTree() and M5()
Now we will discuss an example for Regression using REPTree() and M5():
# Load required packages
library(RWeka)
library(rpart)
library(partykit)

# Load the mtcars dataset
data(mtcars)

# Splitting the data into training and testing sets
set.seed(123)  # For reproducibility
train_indices <- sample(1:nrow(mtcars), size = 0.7 * nrow(mtcars))
train_data <- mtcars[train_indices, ]
test_data <- mtcars[-train_indices, ]

### Using rpart for Regression

# Build the regression tree model
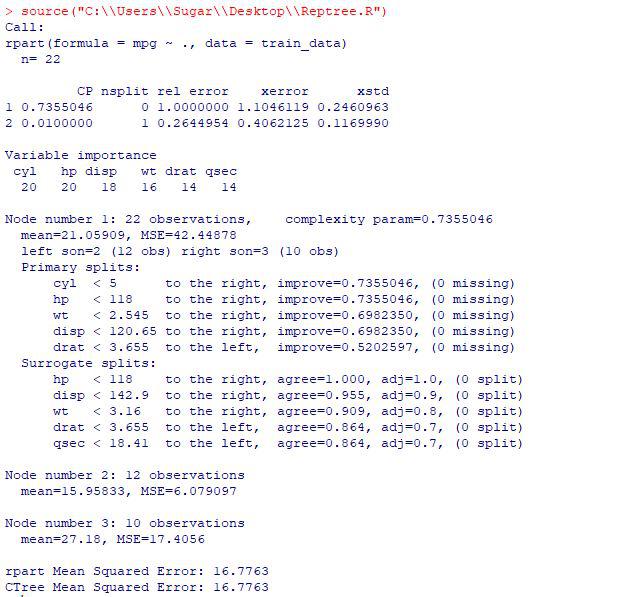
rpart_model <- rpart(mpg ~ ., data = train_data)

# Summary of the rpart model
summary(rpart_model)

# Make predictions on the test set
rpart_predictions <- predict(rpart_model, newdata = test_data)

# Evaluate model performance
rpart_mse <- mean((test_data$mpg - rpart_predictions)^2)
cat("rpart Mean Squared Error:", rpart_mse, "\n")

### Using partykit for Model Trees (M5-like)

# Build the model tree using ctree from partykit
ctree_model <- ctree(mpg ~ ., data = train_data)

# Summary of the ctree model
summary(ctree_model)

# Make predictions on the test set
ctree_predictions <- predict(ctree_model, newdata = test_data)

# Evaluate model performance
ctree_mse <- mean((test_data$mpg - ctree_predictions)^2)
cat("CTree Mean Squared Error:", ctree_mse, "\n")
Output:
Example for Clustering using KMeans()
Now we will discuss Example for Clustering using KMeans():
# Load necessary libraries
library(RWeka)
library(ggplot2)

# Load the iris dataset
data(iris)

# Select only the numerical features for clustering
iris_data <- iris[, -5]  # Exclude the Species column

# Set seed for reproducibility
set.seed(123)

# Run K-means clustering using base R's kmeans function
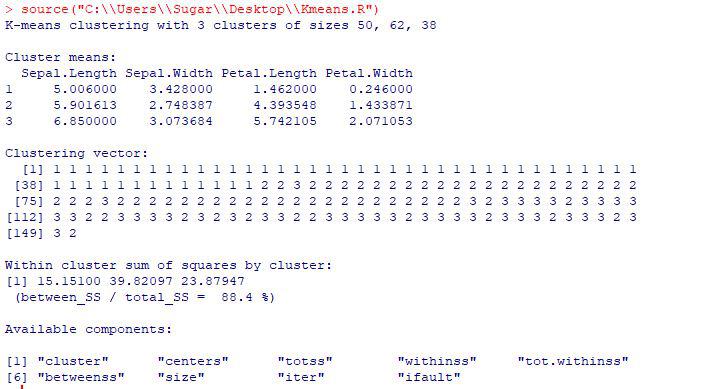
kmeans_model <- kmeans(iris_data, centers = 3, nstart = 20)

# Print the model
print(kmeans_model)
Output:
Why RWeka is Useful for R Users
- Extending R’s Capabilities: R already has robust system studying applications like caret, randomForest, and e1071. However, RWeka complements R’s capabilities via supplying a broader selection of machine studying algorithms from WEKA that won't be available in R's local applications.
- Convenient for R Users: RWeka integrates WEKA into the R workflow, permitting R users to name WEKA algorithms the usage of acquainted R syntax. This affords a seamless manner to contain WEKA’s fashions into R scripts for tasks along with version schooling, assessment, and prediction.
- Consistency in Data Handling: RWeka facilitates R customers keep away from the need to interchange among unique software program gear, providing a steady workflow for coping with statistics in R and making use of advanced system getting to know models from WEKA.
- Experimentation with a Broad Algorithm Set: RWeka offers R users an possibility to without difficulty experiment with a vast set of machine learning algorithms, permitting greater flexibility in model selection and experimentation.
Conclusion
The RWeka package provides powerful tools for implementing machine learning techniques in R. Following the steps described above, you can easily set up, deploy, and evaluate models on datasets so For further application, consider additional algorithms and tuning parameters to improve the performance of the model.
