

Residual Sum of Squares (RSS) measures the total squared difference between the actual values and the values predicted by a regression model. A smaller RSS indicates a better model fit, while a larger RSS suggests greater prediction error.
Example: For example, suppose a company predicts retail store sales based on advertising spend using a linear regression model. The squared differences between the actual and predicted sales are summed to calculate the Residual Sum of Squares (RSS), which helps evaluate the model's accuracy.
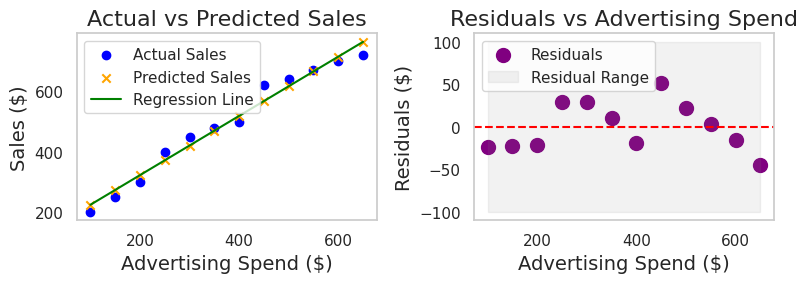
The left plot shows the actual sales, predicted sales, and the regression line for different advertising spend values. The right plot shows the residuals (prediction errors), where points closer to the zero line indicate smaller prediction errors and a better model fit.
Types of Sum of Squares
In regression analysis, RSS is one of the three main types of sum of squares, alongside the Total Sum of Squares (TSS) and the Sum of Squares due to Regression (SSR) or Explained Sum of Squares (ESS).
- Total Sum of Squares measures the total variation in the dependent variable relative to its mean.
- Sum of Squares due to Regression measures the variation explained by the regression model.
- Residual Sum of Squares, on the other hand, measures the variation that is not explained by the model, which is essentially the error or residual component.
Calculating the Residual Sum of Squares
Residual Sum of Squares (RSS) can be calculated using the following formula:
{RSS= \Sigma_{i=1}^n(y_i-f(x_i))^2} Where,
y_i is the ith value of variable to be predicted,f(x_i) is the predicted value, and- n is the number of terms or variables.
Regression Sum of Squares (SSR)
The regression sum of squares measures how well the model is and how close is the predicted value to the expected value.
Consider a set X with n observations. The sum of squares S for this set can be calculated using the below formula:
\bold{S = \Sigma_{i=1}^{n} (X_i- \bar{X})^2} Where,
- Xi is the ith observation of the set,
\bold{\bar{X}} is the mean of the dataset, and- n is the number of observations.
Total Sum of Squares (TSS)
Total sum of squares is used to denote the amount of variation in the dependent variable. The total sum of squares is the sum of the regression sum of squares and the residual sum of squares. It is calculated as:
TSS = RSS + SSR
Where the abbreviations have their usual meaning.
Significance and Limitations
Significance of Sum of Squares
The sum of squares formula can be used for various purposes and has great significance in real life such as:
- It can be used to find the variability of data points from the mean value.
- It helps the investors to make a good decision regarding investment by checking the variance of the stock.
- It can also help to compare the stock price of two different companies.
Limitations of Sum of Squares
The sum of squares has the following limitations:
- A higher dataset makes it very difficult to make decisions in real life as the graph of the data is more spread out.
- An investor may need data of many years to make good decisions but this huge data becomes very difficult to handle.
Solved Examples
Problem 1: Calculate the sum of squares of the set X = [1,2,3,6] if the mean is found to be 3.
Solution:
Given
\bar{X} = 3
X
X-\bar{X} 1
-2
2
-1
3
0
6
3
Using
S = \Sigma_{i=1}^{n} (X_i- \bar{X})^2
S = (-2)^2+(-1)^2+0^2+3^2 S = 4+1+0+9
S = 14
Therefore , The sum of squares of the set is 14.
Problem 2: Calculate the sum of squares of the set X = [3,6,9,12,15] if the mean is found to be 9.
Solution:
Given
\bar{X} = 9
X
X-\bar{X} 3
-6
6
-3
9
0
12
3
15
6
Using
S = \Sigma_{i=1}^{n} (X_i- \bar{X})^2
S = (-6)^2+(-3)^2+0^2+3^2+6^2 S = 36+9+0+9+36
S = 90
\therefore The sum of squares of the set is 90.
Problem 3: Calculate the sum of squares of the dataset X = [1,2,3,4,5,6]
Solution:
In this case we need to calculate the mean first.
\bar{X} = \frac{1+2+3+4+5+6}{6} = 21/6
\bar {X} = 3.5
X
X-\bar{X} 1
-2.5
2
-1.5
3
-0.5
4
0.5
5
1.5
6
2.5
Using
S = \Sigma_{i=1}^{n} (X_i- \bar{X})^2
S = (-2.5)^2+(-1.5)^2+(-0.5)^2+(0.5)^2+(1.5)^2+(2.5)^2 S = 6.25+2.25+0.25+0.25+2.25+6.25
S = 17.50
\therefore The sum of squares of the set is 17.50.
Problem 4: Calculate the sum of squares of the dataset Y = [3,4,5,1,7]
Solution:
In this case we need to calculate the mean first.
\bar{X} = \frac{3+4+5+1+7}{5} = 20/5
\bar {X} = 4
X
X-\bar{X} 3
-1
4
0
5
1
1
-3
7
3
Using
S = \Sigma_{i=1}^{n} (X_i- \bar{X})^2
S = (-1)^2+(0)^2+(1)^2+(-3)^2+(3)^2 S = 1+0+1+9+9
S = 20
\therefore The sum of squares of the set is 20.
Problem 5: Calculate the sum of squares of the set X = [1,4,6,8] if mean is found to be 4.75.
Solution:
Given
\bar{X} = 4.75
X
X-\bar{X} 1
-3.75
4
-0.75
6
1.25
8
3.25
Using
S = \Sigma_{i=1}^{n} (X_i- \bar{X})^2
S = (-3.75)^2+(-0.75)^2+(1.25)^2+(3.25)^2 S = 14.0625+0.5625+1.5625+10.5625
S = 26.75
\therefore The sum of squares of the set is 26.75.
