

A t-test is a method used in statistics to determine if there is a significant difference between the means of two groups when the population standard deviation is unknown. In T-Test statistics, the sample data is a subset of the two groups that we use to draw conclusions about the groups as a whole.
For example, A teacher wants to know whether the average score of a class is different from the school average. A t-test can be used to make this comparison.
Common types of t-tests include the following:
1. One Sample T-Test
This test is used when we have one data set for a sample and we need to determine whether this data set belongs to a particular population or not. The mean value for the population data must be known in this case.
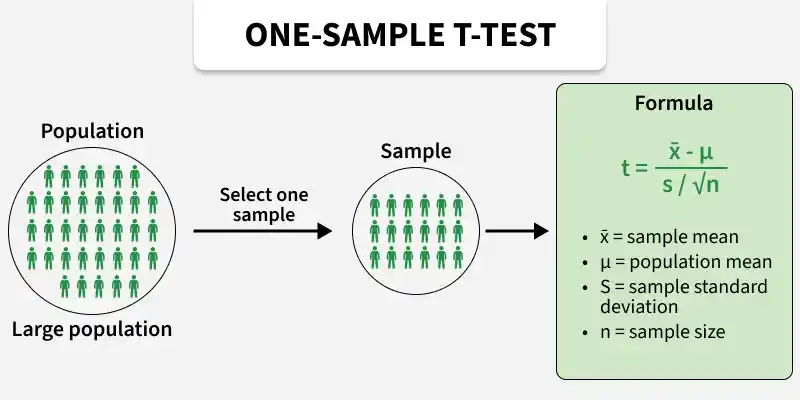
Example: Determining whether the average weight of a sample of mangoes differs from the known average weight of all mangoes on a farm.
2. Independent Samples T-Test
An Independent samples T-test is used when we need to compare the statistical means of two independent samples or groups.
- It helps us determine whether there is a significant difference between the means of the two groups.
- If there is a significant difference, it suggests that the groups likely have different population means; otherwise, they have the same population means.
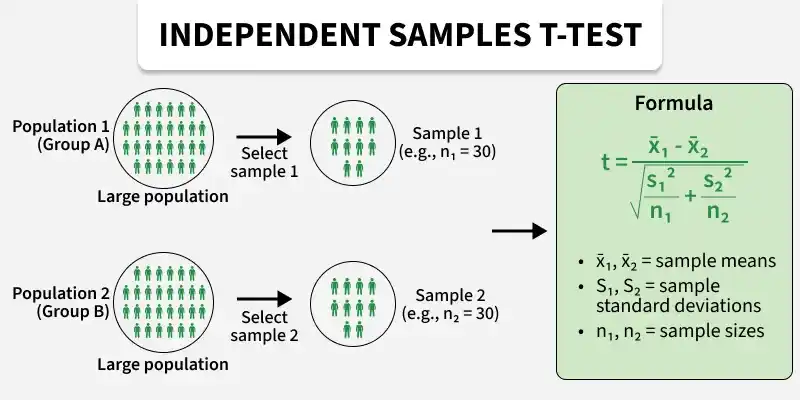
Example: when an investigation aims to determine if there is a significant difference in the mean scores between athletes who follow a specific training camp (Team A) and those who do not (Team B), an independent samples t-test can be conducted.
3. Paired Samples T-Test
A paired samples t-test is used when observations are related or collected from the same subjects at different times.
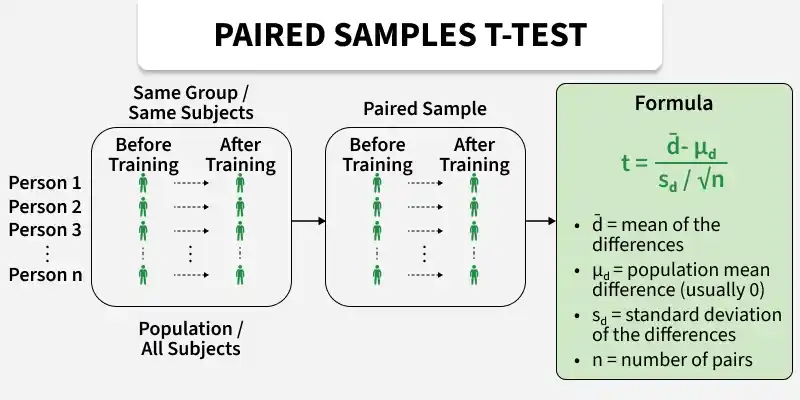
Example: We may use this test to compare the average scores of the players of an athletics team before and after a training program. To calculate the t-value in this case is:
Assumptions of a T-Test
Before applying a t-test, the following assumptions should be satisfied:
- Data is randomly selected.
- Observations are independent.
- Data is approximately normally distributed.
- The variable being analyzed is numerical.
How to Perform a T-Test
The general procedure for conducting a t-test is:
Step 1: Define the null hypothesis (H₀) and alternative hypothesis (H₁).
Step 2: Select a significance level(α), usually 0.05.
Step 3: Use the appropriate t-test formula.
Step 4: Determine the degrees of freedom (df):
- One-sample and paired t-test: df = n − 1
- Independent samples t-test: df = n1 + n2 − 2
Step 5: Use a t-distribution table or statistical software to find the corresponding p-value (or critical t-value).
Step 6: Draw a conclusion:
- If p-value < α, reject H0.
- If p-value ≥ α, fail to reject H0.
T-Distribution Table
A t-distribution table provides critical t-values for different levels of significance (α) and degrees of freedom (df). A concise form of the table for critical t-values is as follows:
Degrees of Freedom (df) | α = 0.05 | α = 0.01 |
|---|---|---|
1 | 12.706 | 63.657 |
2 | 4.303 | 9.925 |
3 | 3.182 | 5.841 |
4 | 2.776 | 4.604 |
5 | 2.571 | 4.032 |
6 | 2.447 | 3.707 |
7 | 2.365 | 3.499 |
8 | 2.306 | 3.355 |
9 | 2.262 | 3.250 |
10 | 2.228 | 3.169 |
➣Practice: Solved Examples
