
Error 404: A Look At Digital Decay

Save to Inbox
In 2005, one of the most intriguing advertising stunts of the internet age was hatched.
Alex Tew launched the The Million Dollar Homepage, where anyone could “own a piece of internet history” by purchasing pixels-plots (minimum of 10×10) on a massive digital canvas. At the price of just one dollar per pixel, everyone from individual internet users to well-known companies like Yahoo! raced to claim a space on the giant digital canvas.
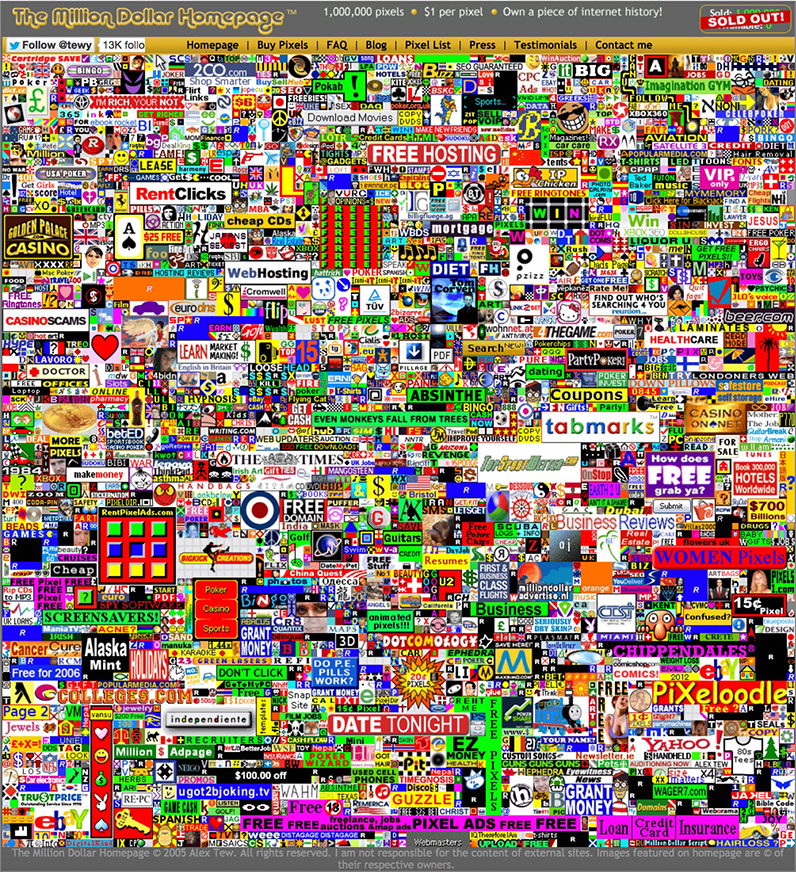
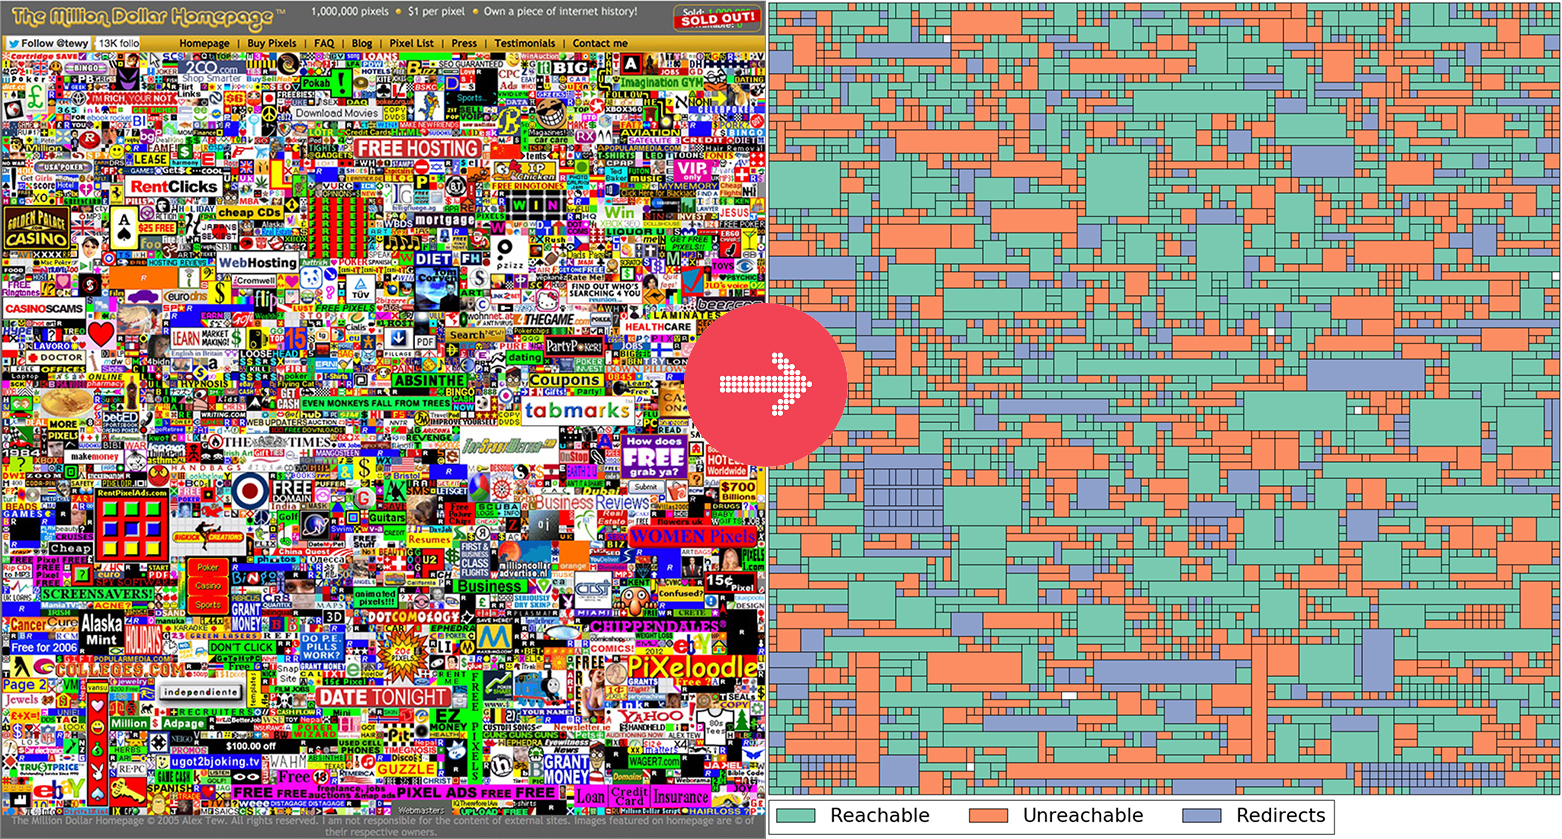
Today, The Million Dollar Homepage lives on as a perfect record of that wacky time in internet history – or so it seems. However, the reality is that many of the hyperlinks on the canvas are now redirects that send incoming users to other sites, while over 20% of them are simply dead.
Here are the links that still work on the Million Dollar Homepage today:
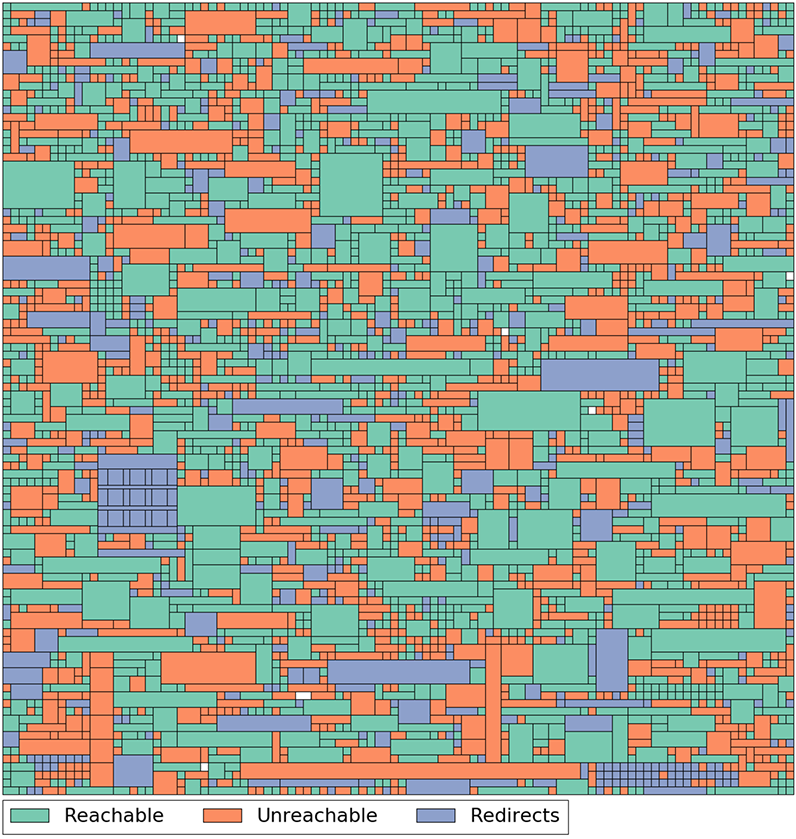
The revealing graphic above, via John Bowers, raises the question – how do hyperlinks disappear, and what implications does this “digital decay” have?
Digital Decay
The internet is stitched together by an incalculable number of hyperlinks, but much like cells in an organism, the sources and destinations have a finite lifespan. Essentially, links can and do die.
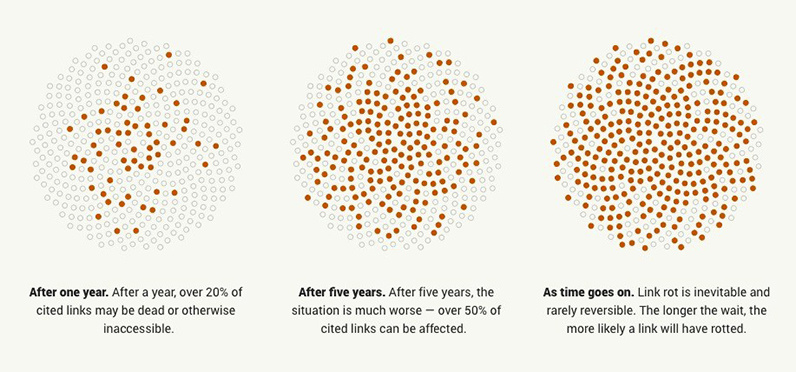
Most “link rot” is the result of website restructuring, or entities going out of business and pulling their website offline.
A high-impact example of this is when Yahoo! pulled the plug on GeoCities, one of the first popular web hosting services. In one fell swoop, roughly 7 million websites (containing a plethora of animated gifs, auto-playing midi files, and traffic counters) went dark forever.
Links can also die because of more deliberate reasons, as well. In 2015, the editor-in-chief of Buzzfeed, Ben Smith, came under fire for deleting thousands of posts from the site (including content that was critical of Buzzfeed advertisers). Journalism has traditionally acted as a public record, so this type of “decay” has serious implications on the credibility of media brands.
Who Cares?
This idea of a public record is at the heart of why digital decay is an issue worth addressing. Once millions of links simply burn out, what will people in the future know about society in the early-ish days of the internet? What record will remain of people’s thoughts and feelings in that era?
I worry that the twenty-first century will become an informational black hole.
– Vint Cerf, Internet pioneer
Perhaps more urgent are public records that live in the digital realm. Supreme Court decisions and academia lean heavily on citations to build their arguments. What happens when those citations simply vanish? A Harvard study found that 49% of the hyperlinks in Supreme Court decisions are now broken.
Even that ubiquitous resource, Wikipedia, has serious issues caused by digital decay. Over 130,000 entries link to dead pages – a troubling development, as linked citations are what lend entries their credibility.
Backing Up The Internet
A handful of people are taking steps to archive the internet.
The most well-known solution is Internet Archive’s Wayback Machine, which has archived hundreds of billions webpages over the past 20 years. Even the The Library of Congress – which is well known for archiving digital information such as tweets – contracts Internet Archive to do its web crawling.
The academia-focused Perma is another example of a company looking to create permanent records of the web sources (particularly citations).
Many of the weird and wonderful forums and hand-coded homepages of early internet lore may be gone, but we’re finally taking steps to combat digital decay. As awareness grows, avoiding an “informational black hole” may be possible.


The Countries Developing the World’s AI Models
Which countries lead AI development? Explore why the U.S. dominates, China’s growing influence, and Europe’s challenges.


Ranked: Which Countries Build the Most AI Models?
Key Takeaways:
- The United States develops 50% of the AI models in the dataset, more than twice China’s 24% share.
- Together, the U.S. and China account for 74% of models, leaving other economies far behind.
- The UK ranks third at 5.2%, while Germany and France each account for just over 2%.
The global race to develop artificial intelligence is overwhelmingly concentrated in two countries: the United States and China.
This visualization uses analysis from the World Bank’s World Development Report 2026, based on Epoch AI’s model dataset from May 2026, to show where AI models are being developed.
Which Countries Develop the Most AI Models?
The following table ranks economies by their share of AI models, according to the World Bank’s analysis of Epoch AI data.
| Rank | Economy | AI Models (%) |
|---|---|---|
| 1 | 🇺🇸 United States | 50.0 |
| 2 | 🇨🇳 China | 24.0 |
| 3 | 🇬🇧 United Kingdom | 5.2 |
| 4 | 🇨🇦 Canada | 3.1 |
| 5 | 🇰🇷 South Korea | 2.3 |
| 6 | 🇩🇪 Germany | 2.2 |
| 7 | 🇫🇷 France | 2.1 |
| 8 | 🇯🇵 Japan | 1.5 |
| 9 | 🇨🇭 Switzerland | 1.4 |
| 10 | 🇭🇰 Hong Kong SAR, China | 1.1 |
| -- | Other countries | 7.1 |
The U.S. leads with 50%, followed by China at 24%. The UK is a distant third at 5.2%, while Canada ranks fourth at 3.1%. No other individually listed economy exceeds 2.3%.
Why Does the U.S. Dominate AI Development?
America’s advantage comes from its combination of venture capital, leading technology companies, research talent, and computing infrastructure.
Companies including OpenAI, Google, and Anthropic benefit from an established cloud ecosystem and access to advanced semiconductors. Federal research funding and policies supporting domestic chip production have also strengthened this environment.
The country’s leadership extends beyond developing models to operating some of the world’s most widely used AI chatbots.
Is China Closing the AI Gap?
China’s 24% share trails America’s substantially, but model quantity does not necessarily indicate technological capability. Chinese developers including DeepSeek and Alibaba have narrowed the performance gap with leading American systems, particularly through lower-cost and open-weight models.
Although China has considerable influence over the critical minerals powering AI infrastructure, access to advanced chips, computing capacity, and capital remains crucial.
Why Is Europe Falling Behind?
Europe’s relatively small shares reflect challenges including fragmented capital markets, fewer large-scale technology investors, and limited access to computing infrastructure. Regulatory uncertainty may also complicate investment, although Europe’s position cannot be attributed simply to skepticism about AI.
Falling behind in model development could increase dependence on American and Chinese providers, potentially limiting Europe’s control over AI infrastructure and future innovation.
Nevertheless, the World Bank emphasizes that countries can capture substantial economic benefits by adapting existing AI systems rather than developing expensive frontier models themselves.
Learn More on the Voronoi App
To explore how the two leading AI powers compare beyond model counts, see Comparing U.S. vs. Chinese AI Model Performance on Voronoi.
Ranked: 15 Popular Smartphones by Radiation Levels
Compare smartphone radiation levels across 15 popular models, ranked by maximum head SAR, from the iPhone 17 to Samsung devices.


Which Popular Smartphones Have the Highest Radiation Levels?
Key Takeaways
- The iPhone 17 has the highest maximum head SAR among the 15 smartphones compared, at 1.49 W/kg, narrowly ahead of the iPhone 16e at 1.48 W/kg.
- Samsung’s Galaxy Z Fold7 records approximately 3.7 times the maximum head SAR of its Galaxy A16 5G, showing how much measurements can vary within the same brand.
- SAR measures radiofrequency energy absorption under laboratory conditions, not everyday exposure or health risk.
Every smartphone uses radiofrequency waves to communicate with cellular networks, but the amount of energy absorbed during standardized testing can vary significantly between devices.
Using data from Germany’s Federal Office for Radiation Protection (BfS), this visualization ranks 15 popular smartphones by their maximum head Specific Absorption Rate (SAR), measured in watts per kilogram (W/kg).
These measurements offer a standardized way to compare phones, but higher SAR readings do not necessarily indicate greater health risks. Smartphone radiofrequency waves are non-ionizing, unlike higher-energy radiation such as X-rays, and health authorities have not established that exposure from mobile phones within applicable safety limits causes adverse health effects.
Ranking Smartphone Radiation Levels
SAR measurements can differ depending on whether a phone is tested at the ear or near the body. The table below compares both measurements for 15 popular smartphones, ranked by their maximum head SAR values.
| Rank | Manufacturer | Model | Head (W/kg, at the ear) | Body (W/kg, 0.5cm) |
|---|---|---|---|---|
| 1 | Apple | iPhone 17 | 1.49 | 1.49 |
| 2 | Apple | iPhone 16e | 1.48 | 1.49 |
| 3 | Samsung | Galaxy Z Fold7 | 1.40 | 1.24 |
| 4 | Samsung | Galaxy S26 | 1.21 | 1.10 |
| 5 | Xiaomi | Poco X7 Pro | 1.00 | 1.00 |
| 6 | Xiaomi | Xiaomi 17 | 1.00 | 0.99 |
| 7 | Pixel 9 | 0.99 | 1.40 | |
| 8 | Pixel 10 | 0.99 | 1.39 | |
| 9 | Motorola | Edge 60 | 0.95 | 1.22 |
| 10 | Motorola | Moto G85 5G | 0.91 | 1.36 |
| 11 | Motorola | Razr 60 | 0.84 | 1.39 |
| 12 | Samsung | Galaxy Z Flip 7 | 0.69 | 1.21 |
| 13 | Samsung | Galaxy A56 5G | 0.61 | 1.05 |
| 14 | Samsung | Galaxy A26 5G | 0.41 | 0.96 |
| 15 | Samsung | Galaxy A16 5G | 0.38 | 0.94 |
Apple occupies the top two positions, with the iPhone 17 and iPhone 16e separated by just 0.01 W/kg.
Samsung’s Galaxy Z Fold7 follows at 1.40 W/kg, ahead of the Galaxy S26 at 1.21 W/kg. At the other end of the ranking, the Galaxy A16 5G records 0.38 W/kg, the lowest reading among the 15 devices.
Head and Body Measurements Tell Different Stories
A smartphone’s position in the ranking can change depending on whether SAR is measured at the head or near the body.
Motorola’s Razr 60 ranks 11th for head SAR at 0.84 W/kg, but its body SAR of 1.39 W/kg is tied for the fourth-highest reading among the 15 devices.
Google’s Pixel 9 shows a similar pattern, with a body SAR of 1.40 W/kg compared with a head SAR of 0.99 W/kg. Apple’s iPhone 17, meanwhile, measures 1.49 W/kg in both tests.
These measurements come from different standardized testing configurations and do not represent typical daily exposure.
Why Radiation Levels Vary Across Smartphone Brands
SAR readings do not necessarily follow a consistent pattern based on brand, price, or smartphone generation.
Google’s Pixel 9 and Pixel 10 both record a maximum head SAR of 0.99 W/kg. Xiaomi’s Poco X7 Pro and Xiaomi 17 also share the same reading, at 1.00 W/kg.
Motorola’s three featured devices fall within a relatively narrow range, from 0.84 W/kg for the Razr 60 to 0.95 W/kg for the Edge 60.
Factors such as antenna design, operating frequencies, and testing conditions can influence SAR measurements. Because these readings are specific to individual devices, they cannot be used to characterize an entire smartphone brand.
Smartphones also differ in the materials and components used in their construction. Our visualization of the critical metals inside a smartphone looks at the resources used to manufacture modern mobile devices.
Does Higher Smartphone Radiation Mean Greater Health Risk?
Not necessarily. SAR measures the maximum rate at which radiofrequency energy is absorbed by tissue during standardized testing. It does not measure a person’s cumulative exposure throughout a typical day.
The amount of radiofrequency energy a phone transmits varies with signal strength and other network conditions. Keeping the phone away from your head, such as by using speakerphone or headphones, can also reduce exposure.
Unlike ionizing radiation, radiofrequency waves do not have enough energy to directly ionize atoms or damage DNA in the way that X-rays can.
According to the U.S. Food and Drug Administration, the weight of scientific evidence has not linked cellphone radiofrequency radiation with health problems. Research and safety monitoring continue.
Ultimately, these rankings compare maximum SAR measurements under laboratory conditions, not which smartphones are safer or more dangerous to use.
Learn More on the Voronoi App
If you enjoyed this visualization, check out The Percentage of Internet Users by Country on the Voronoi app.
-
 Jobs2 weeks ago
Ranked: The Most and Least Trusted Professions in 2026
-
Education2 weeks ago
Ranked: Countries With the Smartest Students in 2026
-
Automotive3 days ago
Ranked: How Far Popular Cars Can Drive on $100 of Fuel
-
Countries2 weeks ago
Ranked: Births vs. Deaths in 12 Major Countries
-
Travel1 week ago
Ranked: The World’s Most Welcoming Countries in 2026
-
Military3 weeks ago
The World’s Largest Militaries, by Four Different Measures
-
Economy2 weeks ago
Where Each U.S. State Gets Its Tax Revenue From
-
Jobs2 weeks ago
Mapped: Unemployment Rates Around the World in 2026


