Nonlinear Joint Offsets#
Download notebookThis problem models a cantilever column with eccentric axial load using the joint offset feature.

L  =  120.0
Lr = L/40
Create an Elastic xara.FrameSection
import xara
E = 29e3
I = 6*12**3/12
section = xara.FrameSection("Elastic",
    E  = E,
    G  = 11e3,
    Iy = I,
    Iz = 6*12**3/12,
    J  = 2*12**4/3,
    A = 1e3
)
P = 2000
import numpy as np
from xara.helpers import find_node

def create_model_offset(transform, element, ne=4):

    model = xara.Model(ndm=3, ndf=6)

    model.section(section)

    nn = ne + 1 # number of nodes

    for i, y in enumerate(np.linspace(0, L, nn)):
        if i == nn-1:
            x = -Lr
        else:
            x = 0
        model.node(i, (x, y, 0))

    # Fix the nodes
    tip = find_node(model, y=L)
    model.fix(0,   (1, 1, 1, 1, 1, 1))
    # model.fix(tip, (0, 0, 1, 1, 1, 0))
    # for i in range(1, nn-1):
    #     model.fix(i, (0, 0, 1, 1, 1, 0))


    model.geomTransf(transform, 1, (1, 0, 0))

    model.geomTransf(transform, 2, (1, 0, 0),
                     jntOffset=(0, 0, 0,  Lr,0, 0))

    # Create the elements
    for i in range(ne):
        transform = 2 if i == ne-1 else 1
        model.element(element, i, (i, i+1),
                      section=section,
                      transform=transform,
                      shear=1)


    #
    # Load
    #
    tip = find_node(model, y=L)
    model.pattern(
        xara.StaticPattern([
            xara.NodalLoad(model, {tip:  (0,-P,0,  0,0,0)})
        ])
    )

    return model
Analysis#
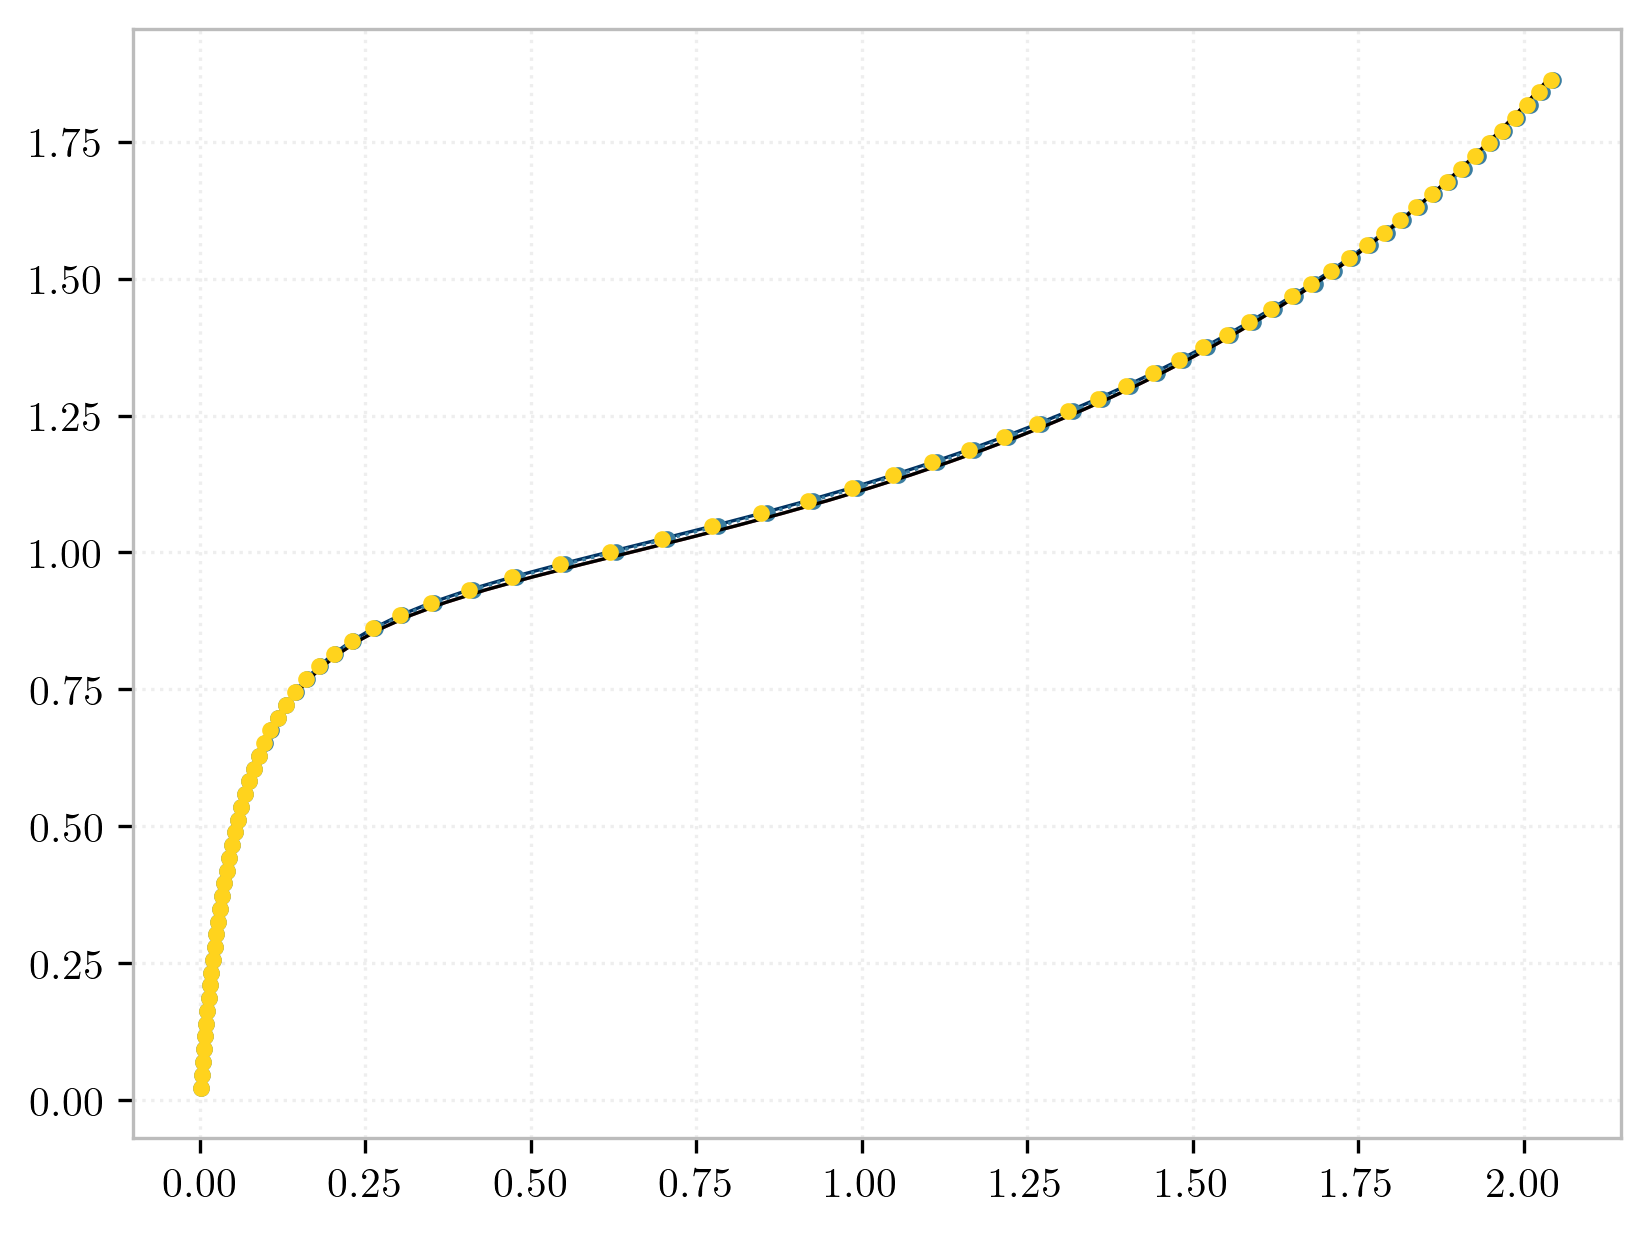
A xara.StaticAnalysis is setup, and after each step, the load factor \(\lambda\) and tip rotation is stored in a list for plotting.
def analyze(transform, element):
    nsteps = 80

    # Create model
    model = create_model_offset(transform=transform, element=element)

    # Find the tip node
    tip = find_node(model, y=L)

    # Setup a static analysis
    Pcr = E*I*np.pi**2/(L*2)**2
    analysis = xara.StaticAnalysis(model,
                                   test=("Energy", 1e-16, 10, 0),
                                   integrator=("LoadControl", 1/20))

    # Perform n steps of the analysis
    u, N = [], []
    for i in range(nsteps):
        analysis.analyze(1)
        u.append(model.nodeDisp(tip, 6))
        N.append(P*model.getLoadFactor(1)/Pcr)

    return u, N
Results#
import matplotlib.pyplot as plt
fig, ax = plt.subplots()

ax.plot(*analyze("Spherical",      "CosseratFrame"))
ax.plot(*analyze("Corotational",   "ForceFrame"))
ax.plot(*analyze("Corotational",   "ShearFrame"), ':.')
ax.plot(*analyze("Corotational",   "ElasticFrame"))
ax.plot(*analyze("Identity",       "CosseratFrame"), ".");