

API Monitoring in Postman is a feature that continuously checks the health and reliability of APIs by running predefined collections from the cloud at scheduled intervals. It helps development and operations teams proactively identify issues, ensure APIs behave as expected, and maintain service reliability throughout the development lifecycle.
- Schedules API collections to run automatically at predefined intervals.
- Detects API failures by validating response codes, headers, body content, and test assertions.
- Tracks API health over time with detailed execution history and performance metrics.
- Sends notifications or alerts when monitored APIs fail or do not meet expected conditions.
Prerequisites for API Monitoring
Before creating an API monitor in Postman, ensure the required resources and configurations are available for successful execution.
- A Postman account with access to your workspace.
- An API collection containing the requests to monitor.
- Test scripts to validate API responses.
- An environment with required variables (if applicable).
- A stable internet connection.
API Monitoring Workflow
API Monitoring follows a structured process to execute API requests automatically, validate responses, and generate monitoring results.
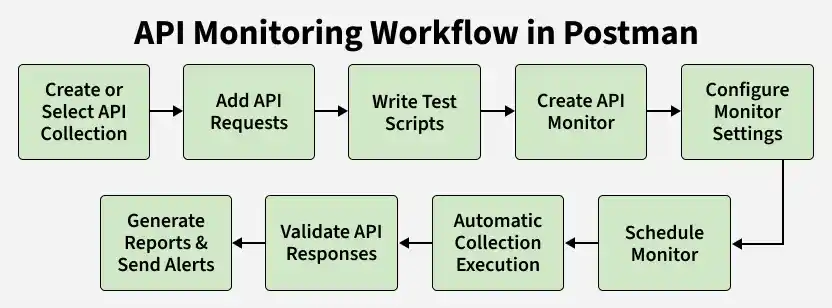
- Create or Select API Collection: Create a new collection or select an existing one containing the API requests to monitor.
- Add API Requests: Add all API requests that should be executed during monitoring.
- Write Test Scripts: Create test scripts to validate API responses and assertions.
- Create API Monitor: Associate the selected collection with a monitor.
- Configure Monitor Settings: Configure the environment, region, notifications, and other settings.
- Schedule Monitor: Specify how often the monitor should run.
- Automatic Collection Execution: Postman automatically runs the collection according to the configured schedule without manual intervention.
- Validate API Responses: The monitor verifies whether the API responses meet the expected conditions defined in the test scripts.
- Generate Reports & Send Alerts: Postman generates execution reports and sends alerts when requests fail or tests do not pass.
How to Create an API Monitor in Postman
Creating an API monitor enables Postman to execute API collections automatically at scheduled intervals.
Step 1: Open the API Collection
Open Postman and select the collection you want to monitor.
Step 2: Create a Monitor
Click More Options (⋮) and select Monitor Collection or Create Monitor.
Step 3: Configure Monitor Settings
Enter the monitor name, select the collection, choose an environment, and configure the monitoring schedule.
.png)
Step 4: Set the Monitoring Schedule
Select the monitoring region, enable email notifications, configure timeout, retry options, SSL validation, and request delay.
.png)
Step 5: Save and Start the Monitor
Review the configuration and click Create Monitor. Postman will automatically execute the collection according to the configured schedule.
API Monitoring Metrics
API Monitoring Metrics are the key measurements used to evaluate the health, availability, performance, and reliability of an API. These metrics help identify issues early and ensure APIs continue to function as expected.
- Response Time Measures the time taken by an API to respond to a request. Lower response times indicate better performance.
- HTTP Status Codes: Verifies that the API returns the expected HTTP status codes, such as 200 OK, 404 Not Found, or 500 Internal Server Error.
- Availability (Uptime): Measures whether the API is accessible and operational during the monitoring period. High availability ensures reliable API access.
- Error Rate: Tracks the number or percentage of failed API requests or test assertions. A high error rate may indicate API or server issues.
- Traffic Volume: Measures the number of API requests received over a specific period. It helps identify usage patterns and detect unusual traffic spikes or drops.
Monitoring Results and Reports
After each monitor execution, Postman provides detailed execution reports to help analyze monitor performance.
- Execution Status: Indicates whether the monitor run passed or failed.
- Request Summary: Displays the total, passed, and failed requests.
- Test Summary: Shows the results of all test assertions.
- Execution Logs: Provides request details and error messages for troubleshooting.
- Run History: Stores previous monitor executions for comparison and analysis.
Notifications and Alerts
Postman can send notifications when a monitor detects failed requests or test assertions. These alerts help teams quickly identify issues and take corrective action.
- Email Notifications: Sends email alerts when a monitor run fails or encounters errors.
- Failure Alerts: Notifies users when API requests or test assertions do not pass.
- Consecutive Failure Control: Stops repeated notifications after a specified number of consecutive failures.
- Retry Notifications: Sends updated results if the monitor is configured to retry failed runs.
- Quick Issue Detection: Helps teams respond to API failures before they impact users.
Use Cases of API Monitoring
- Monitor production APIs to ensure continuous availability.
- Detect API failures after new deployments or updates.
- Verify the availability of third-party APIs and services.
- Track API performance and response times over time.
- Receive alerts for failed requests or test assertions.
- Ensure critical business APIs remain operational 24/7.
Advantages of API Monitoring
- Detects API failures and performance issues early.
- Continuously monitors API availability and reliability.
- Reduces manual testing through automated monitoring.
- Sends alerts when requests or tests fail.
- Helps improve API quality and user experience.
Limitations of API Monitoring
- Requires a Postman account and an internet connection.
- Monitoring frequency may depend on the selected Postman plan.
- Cannot replace load, stress, or security testing.
- Monitors only the configured requests and test scripts.
- Incorrect test scripts may produce inaccurate monitoring results.
